DIGITAL ANALYTICS PLATFORM
nVISION
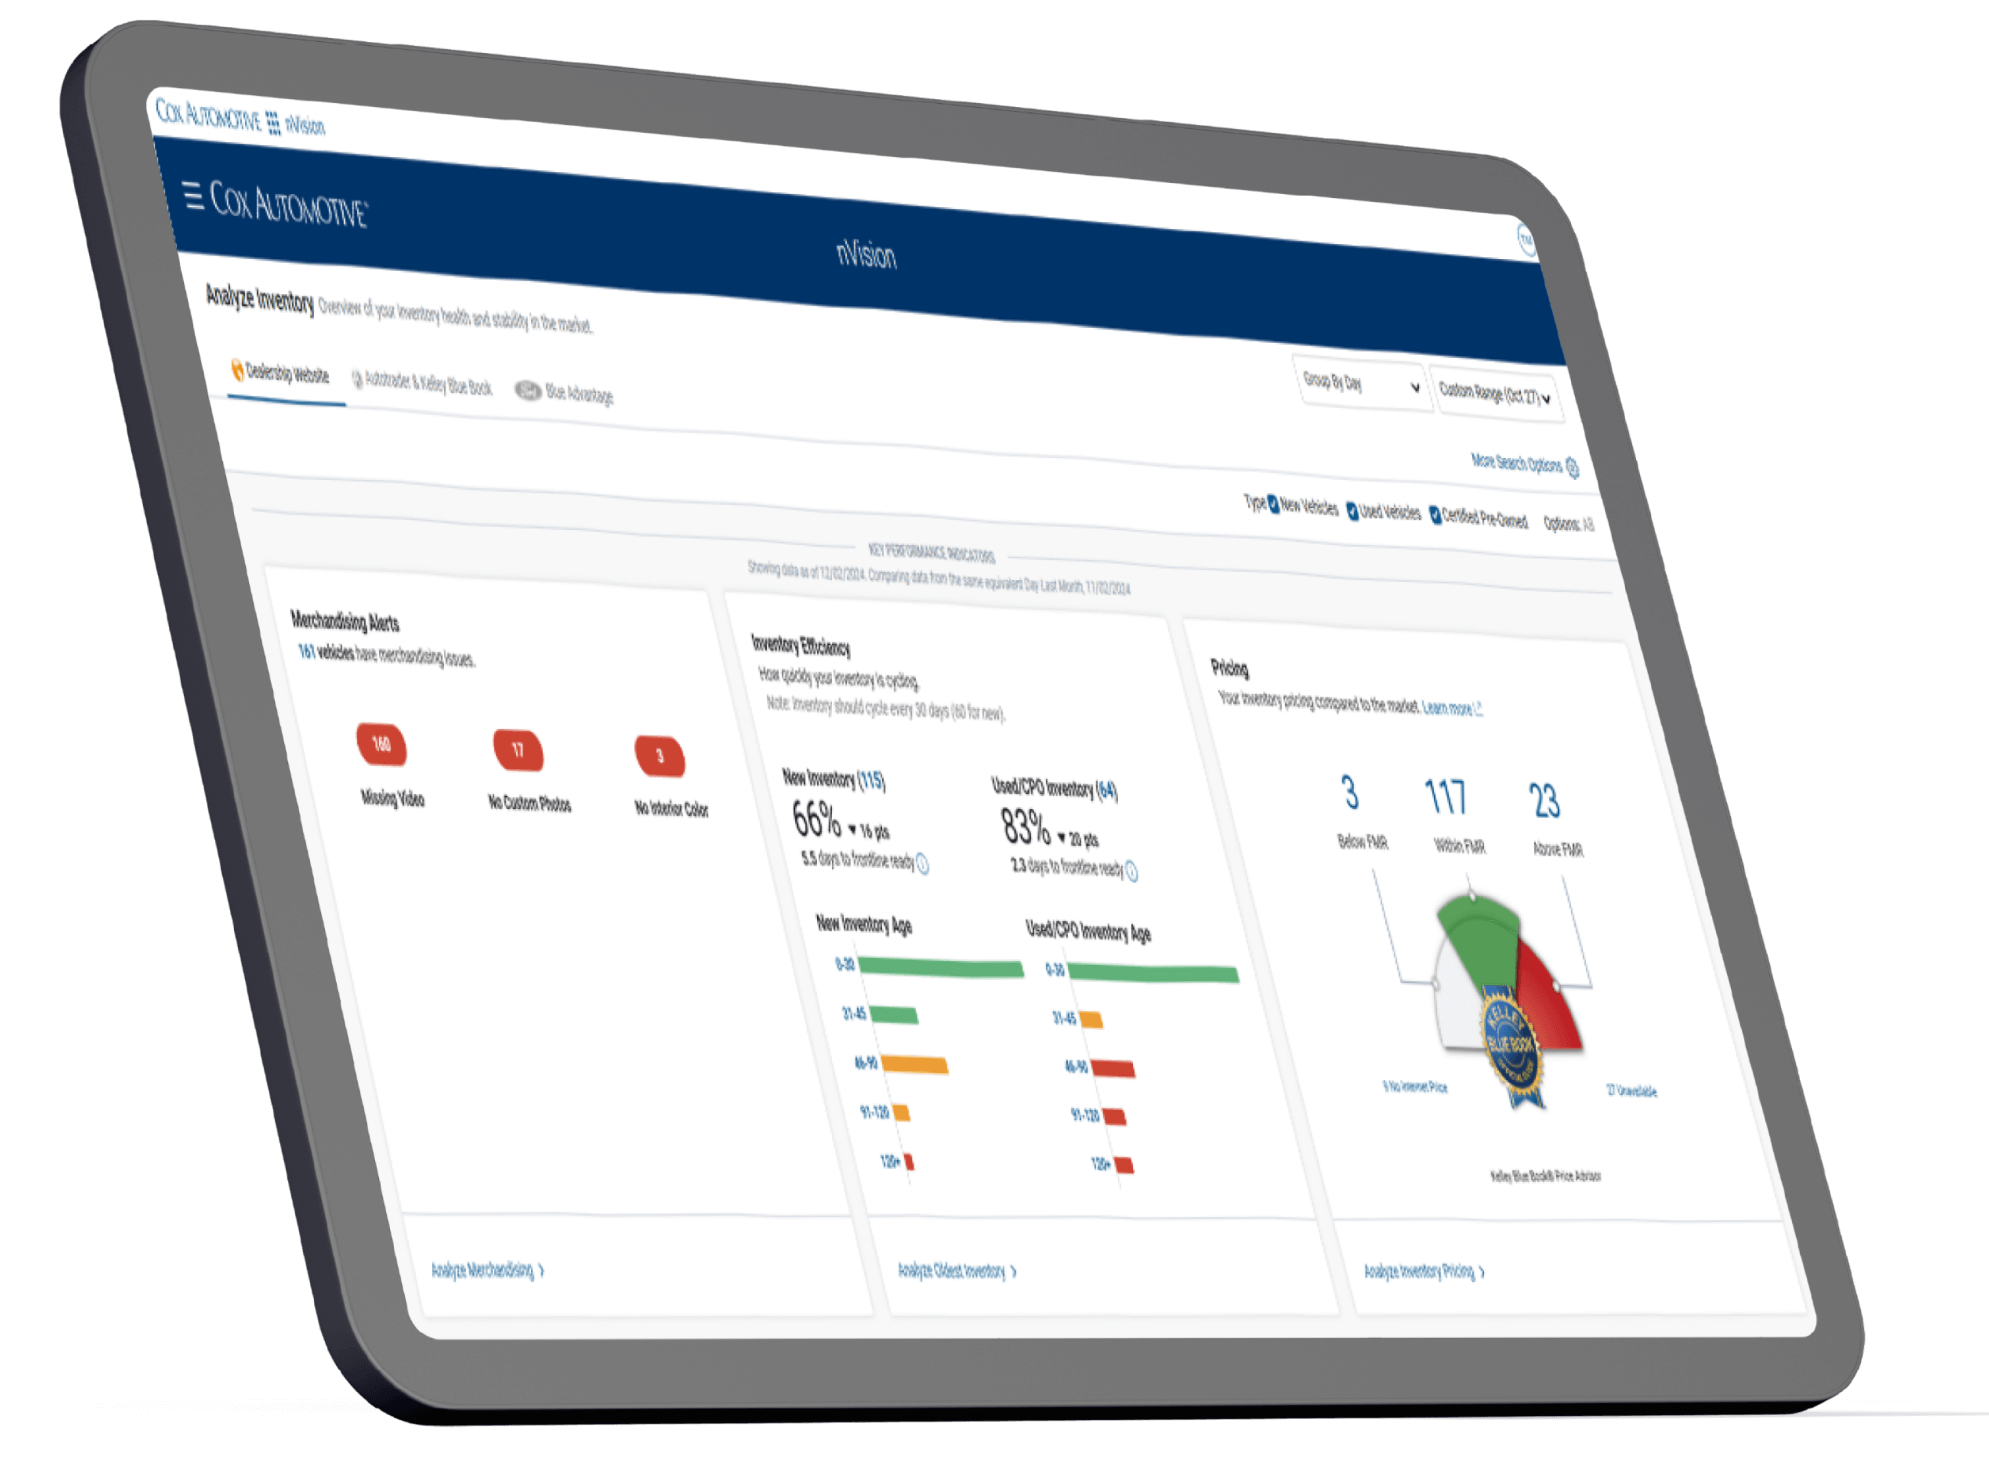
Drive your digital marketing strategy with comprehensive performance analytics and reporting.
Stats Title
KPIs to benchmark your performance your way

ACTIONABLE, TRANSPARENT INSIGHTS
From reviewing key website metrics and inventory health to tracking digital retailing performance and more, understand your entire digital presence with nVision.

Analyze Website Traffic
Review top key performance metrics, including website traffic, engagement, VDP views, quality scores and more.

Analyze Digital Retailing
View a robust reflection of your Digital Retailing traffic from Accelerate My Deal activity, along with other shopper funnel metrics.

Analyze Sales
Understand the connection between your digital marketing activities and lot sales with a variety of aggregation metrics.

Analyze Vehicle Listings
Maximize the impact of your Autotrader and Kelley Blue Book listings to meet your sales strategy and move inventory.

Explore Audiences
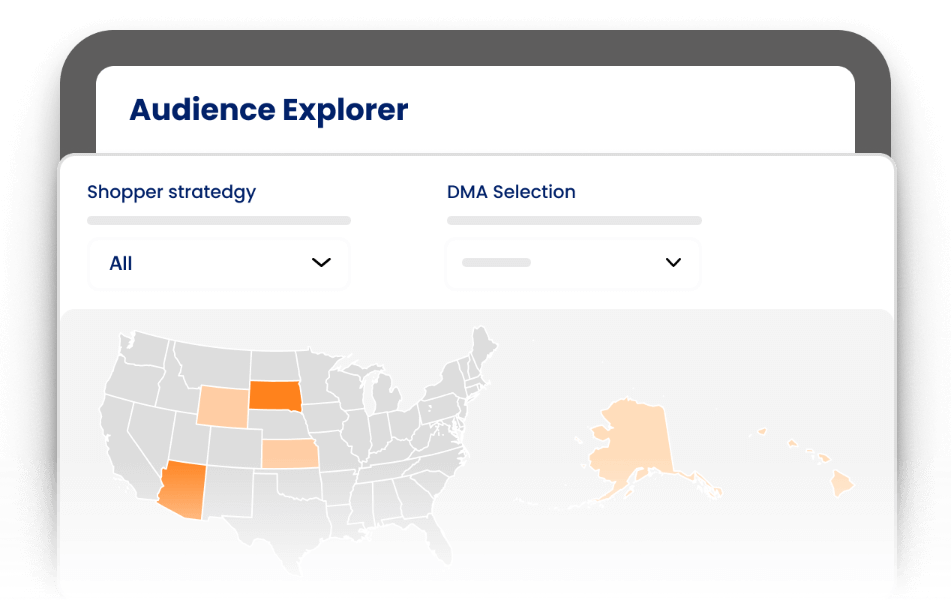
Leverage real-time data, including proprietary Cox Automotive insights, from our Audience Explorer tool to build targeted advertising plans.

Dealer.com Strategists
Receive Receive expert guidance building a competitive digital strategy by applying insights from advertising metrics to SEO and managed services campaigns.
Register for the next nVision Dealer Academy training session
Seamless
Integrations
Our auto dealership software integrates with other Cox Automotive solutions and third-party car dealer management software. Sharing data across the dealership makes the customer experience seamless and builds trust.
FAQs
Our platform processes a wide range of data, including sales, inventory, and customer engagement metrics. This comprehensive approach ensures you have all the information you need at your fingertips.
Absolutely. Our dashboards are fully customizable, allowing you to focus on the metrics that matter most to your dealership.
Yes, our platform provides real-time data updates, ensuring you always have the most current information available.
We offer comprehensive support, including a dedicated team ready to assist with any challenges you may face. Our goal is to ensure your success and satisfaction.
Get started with Dealer.com
We’d love to help you optimize your sales and profitability
Take a Guided Demo
Create a personalized demo to see how to accelerate the purchase process and improve sales.
Talk to a Cox Automotive Rep
Schedule a time to discuss how help you achieve your business goals.
Required form fields

